
State Of Data Science In Domestic Indian Firms – 2021
Many organisations across sectors in India firmly believe that data science is a crucial aspect of an enterprise to scale sustainably. This has accelerated the overall adoption of advanced analytics and AI in India, with organisations investing considerably to improve their analytics capabilities. This report is an effort to get an overview of data science in domestic Indian enterprises.
The report aims to present the state of data science in the domestic Indian market by analysing the analytics adoption of key Indian firms. The study considers around 50 key organisations to quantify the analytics maturity and penetration using different parameters across industries. It provides a greater understanding of what mature organisations are doing to draw tangible results from their analytics investments.
The study reveals that almost all enterprises have realised the importance of data science. All organisations are leveraging analytics at some level to improve their decision-making and automate/operationalise processes for better productivity and cost-effectiveness. The study observes that all sectors are at different stages in terms of their analytics penetration and maturity. At the same time, all of them have a scope for improvement.
Read reports from previous years here:
2014 | 2016 | 2017 | 2018 | 2019
Definitions
Around 50 large-sized companies were considered for this study. Different firms across sectors with significant revenues in the Financial Year 2021 were sampled for the analysis. The following sectors were considered: Power, Oil Drilling & Refineries, Steel, Automotive, Telecom, Public Sector Banks, Private Sector Banks, Financial Services (Non-banking), and E-commerce.
Analytics penetration is a metric that denotes the degree of infusion of analytics function in an organisation. It quantifies the approximate number of analytics professionals employed by the organisation for every employee within the whole firm. So, a penetration of 1% should be read as one analytics/data science professional for every 100 employees with the organisation.
Analytics maturity is the metric to quantify the quality and depth of analytics adopted within an organisation. Maturity is a combination of three factors:
- Employee Tenure
- Employee seniority in that organisation
- Percentage of AI in the analytics function
Analytics adoption is calculated at the penetration of more than 1.0%, i.e. the organisation has at least one analytics professional to support 100 employees within the organisation. This threshold for the 2018 and 2019 report was considered at 0.75%.
It is important to note that these are relative metrics, and organisations, as plotted here, are based on a comparative study with respect to each other and should not be compared to other organisations outside this study. Also, the values may differ in terms of global standards. Another point to keep in mind is that the numbers would be negatively biased towards organisations that outsource their analytics functions heavily.
Key Highlights
Adoption
- Analytics adoption among the largest firms in India stands at 74.5% in 2021.
- Private Sector Banks and E-commerce sectors have the highest analytics adoption at 100.0%.
- Around 43.4% of analytics functions of the top Indian firms are based out of Mumbai, followed by Delhi at 24.3%.
- Almost one in three or 32.3% of analytics functions in India work to support the Sales & Marketing teams.
Budget
- Indian firms had an analytics budget of $2 billion in 2021, with an average of $27 million per company.
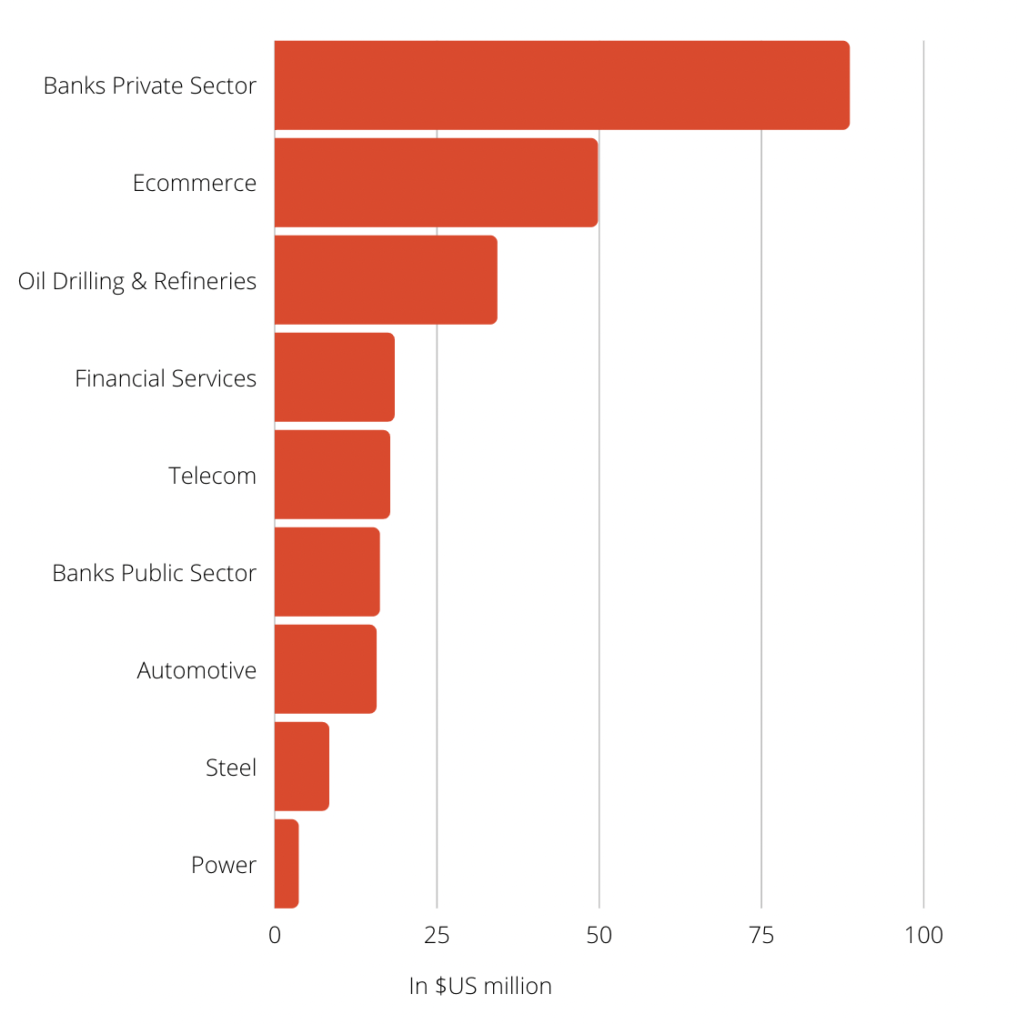
- Private Sector Banks had the highest annual average analytics budget per company at $88.5 million, followed by E-commerce enterprises at $50 million.
- ICICI Bank, Flipkart, and HDFC Bank have the biggest analytics units among Indian enterprises and Myntra, Flipkart, and Bharti Airtel has the highest analytics penetration.
Penetration vs Maturity
- The E-commerce sector is the best performer among all the industries and has the highest penetration at 6.1%. This is followed by Private Sector Banks at 2.2%. Both of these sectors fall behind in terms of maturity.
- Analytics professionals in the Power and Telecom sector have the highest median work experience at 10.2 years. Power also has the highest median tenure at 6.6 years.
- Oil Drilling & Refineries have the highest share of their analytics professionals working on advanced analytics or AI at 37.6%, followed by E-commerce at 33.2 %.
Analytics Adoption
Analytics Adoption By Sector
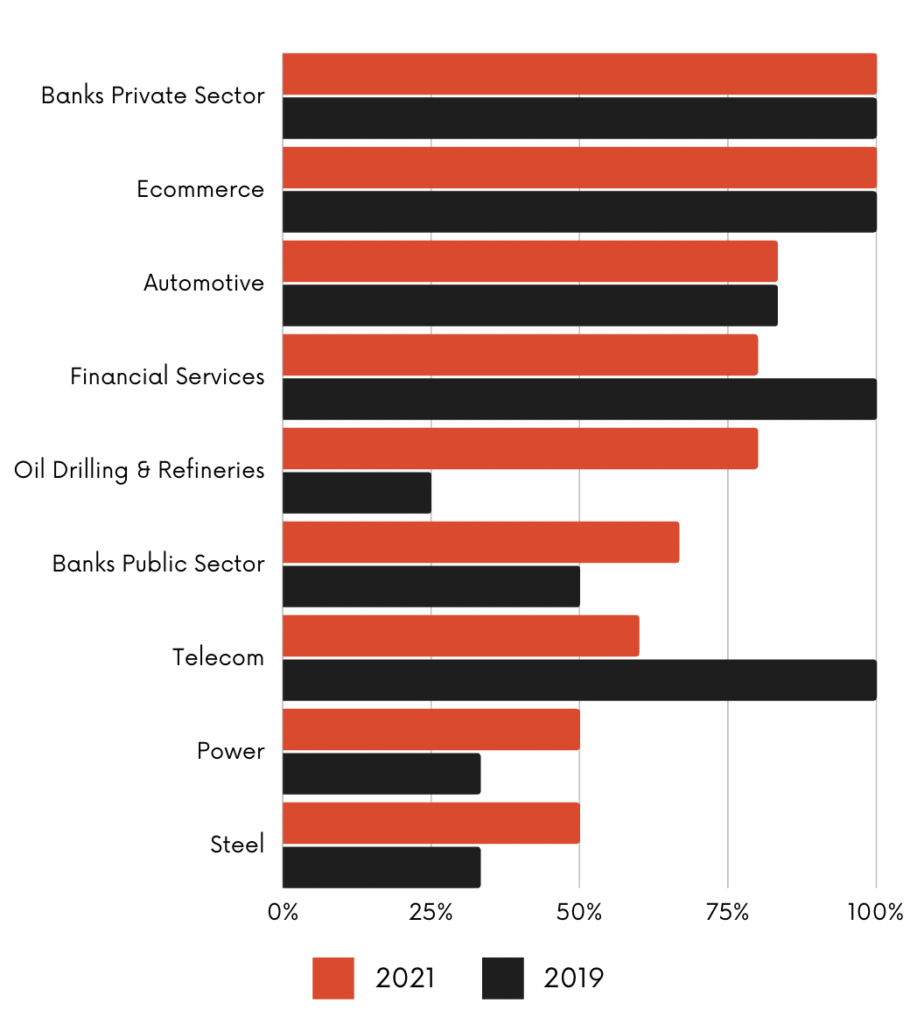
The overall adoption of Analytics & Data Science at large Indian firms is around 74.5%. In other words, 74.5% of large firms in India have analytics penetration greater than 1.0% in 2021. This is higher than the adoption rate in 2019 when it was at 70%.
That’s a healthy adoption rate, given that most of these large firms are into traditional businesses like energy, steel, power, oil, etc.
- E-commerce has the highest adoption rate at 100.0%, the same as 2019.
- E-commerce companies make use of the vast amounts of data generated through digital transactions to analyse consumer behaviour. This helps the firms in improving sales and customer relationships.
- Along with e-commerce, all Private Sector Banks (100.0%) also use analytics and data science to support their functions.
- Data plays a central role in banks as it is used across their value chain – in customer acquisition, segmentation, retention, and ensuring security through credit score analyses and fraud detection. Analytics has thus become critical for private banks to stay relevant in the competition.
- Public Sector Banks fall behind in their analytics adoption (66.7%) as compared to private banks. This adoption rate, however, is greater than 2019, when it was at 50.0%.
- Non-banking Financial Service providers and insurance companies (80.0%) also have a lower adoption rate than private banks.
- Many private non-banking Financial Providers are subsidiaries of larger Private Sector Banks or Enterprises that already have a high analytics penetration. Some of these companies are thus leveraging the analytics services of already set up teams.
- The public sector companies again fall considerably behind in analytics adoption as compared to the private enterprises.
- Analytics adoption rate among the top Automotive enterprises in India is relatively high at 83.3%, same as 2019.
- The Telecom industry has a considerably lower analytics adoption rate, at 60.0%.
- Outsourcing is gaining a significant place in the current telecom market. Businesses prefer to hire vendors for all their non-core functions and focus on their niche area of services. This strategy is adopted mainly due to the unique set of challenges in leveraging analytics due to the rapid changes and cut-throat competition.
- Also, while the private service providers have a high adoption rate of analytics and data science, public telecom firms fall significantly behind.
- Despite being one of the most traditional industries, analytics adoption in Oil drilling & Refineries has increased considerably from just 50% in 2019 to 80.0% in 2021.
- Enterprises in the Oil Industry have ramped up their hiring in advanced analytics to develop sophisticated AI applications and automate tasks that can help avoid putting human beings in danger and reduce errors.
- The Steel industry and the Power industry continue to have lower adoption rates at 50.0%.
Tenure vs Adoption
The adoption of data analytics has become central to ensure the sustainable growth of the organisation. Enterprises across industries have initiated several hiring drives and launched dedicated programmes to source the best analytics talent for better adoption.
Along with attracting the best talent, retention also becomes critical to the analytics function. Significant median employee tenure is indicative of the maturing and stable nature of the industry.
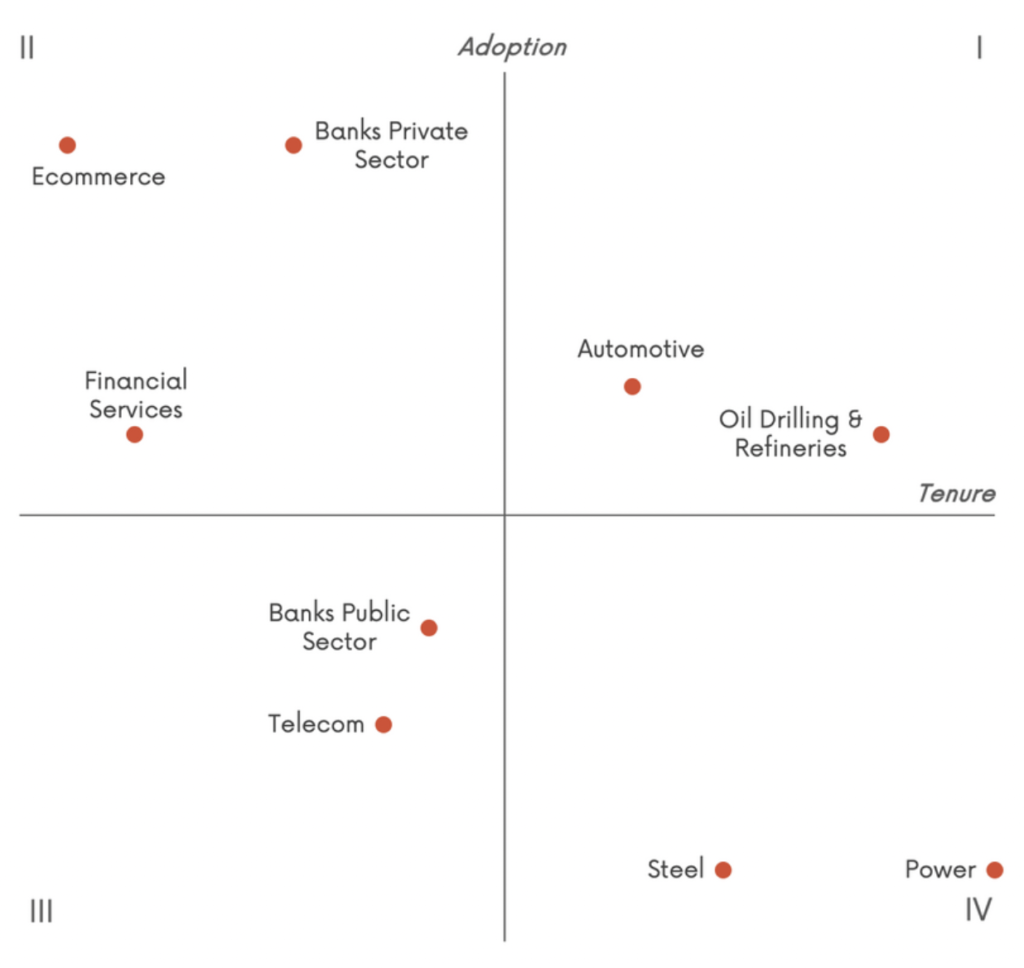
- The Automotive sector continues to be in Quadrant I with a relatively high adoption rate and a high median tenure of their analytics employees. An increase in the analytics adoption among Oil Drilling & Refinery firms pushes the industry into Quadrant I.
- Private banks and E-commerce companies have the highest adoption rate but a lower maturity in terms of employee median tenure. Similarly, non-banking firms providing Financial Services has a high adoption rate but one of the lowest averages in median employee tenure. These three sectors come in Quadrant II.
- Lower adoption in the public sector and a low median tenure puts the Public Sector Banks and the Telecom industry in Quadrant III.
- Traditional industries – Power and Steel – both have a low adoption rate and higher maturity in employee tenures. This puts them in Quadrant IV.
Analytics Adoption Across Cities
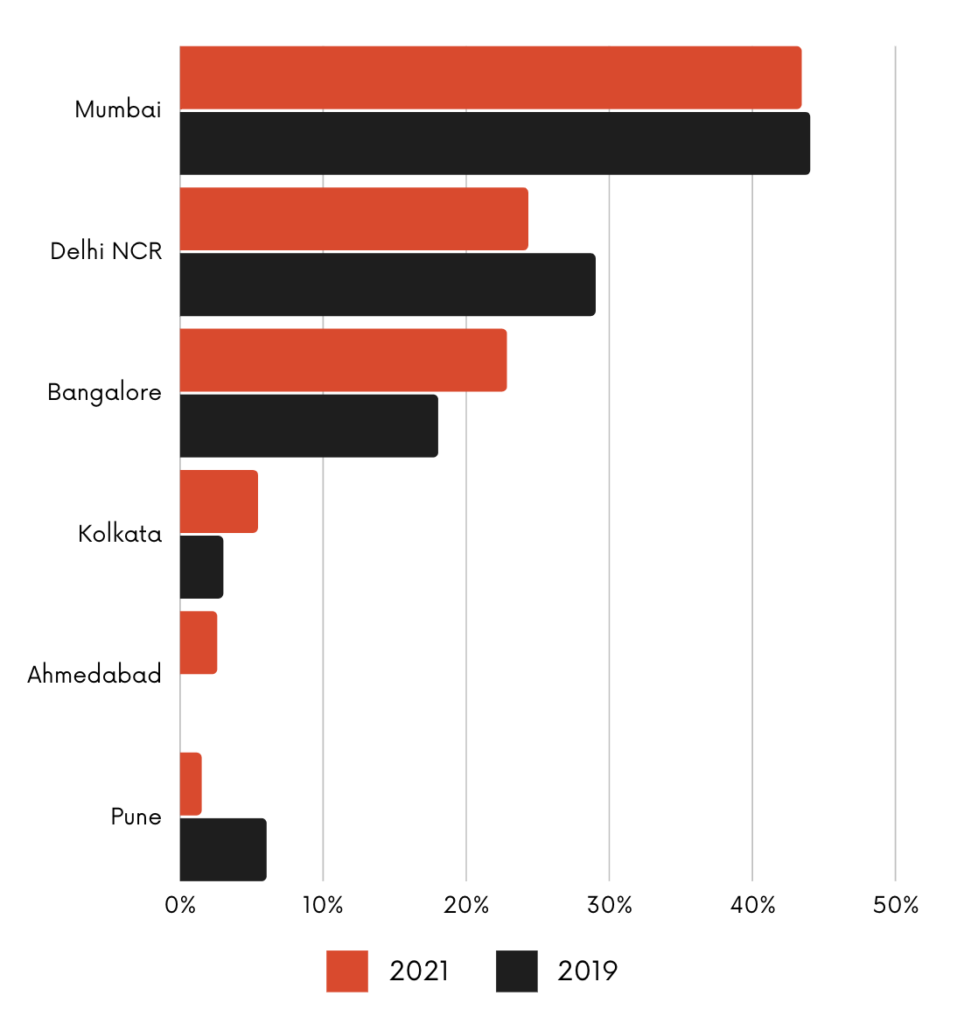
In terms of city-wise adoption, Mumbai leads the pack becoming the largest data analytics employer in the country. After Mumbai, Delhi NCR and Bangalore have a higher analytics concentration. The numbers for the city-wise distribution of analytic functions are similar to the ones in 2019.
- 43.4% of all analytic functions of large Indian firms are based out of Mumbai, followed by Delhi NCR at 24.3%.
- More than nine in ten (90.5%) analytics functions are stationed in just three cities – Mumbai, Bangalore & Delhi NCR.
- The remaining 5.4%, 2.5%, and 1.5% of the analytics functions work from Ahmedabad, Kolkata, and Pune.
Analytics Adoption Across Job Functions
There are several ways data and analytics function in an organisation. In one model, the analytics function works as support units to different departments. In other cases, analytics is embedded in the IT function with a team working in collaboration with the traditional IT team on areas where analytics can deliver the most significant value.
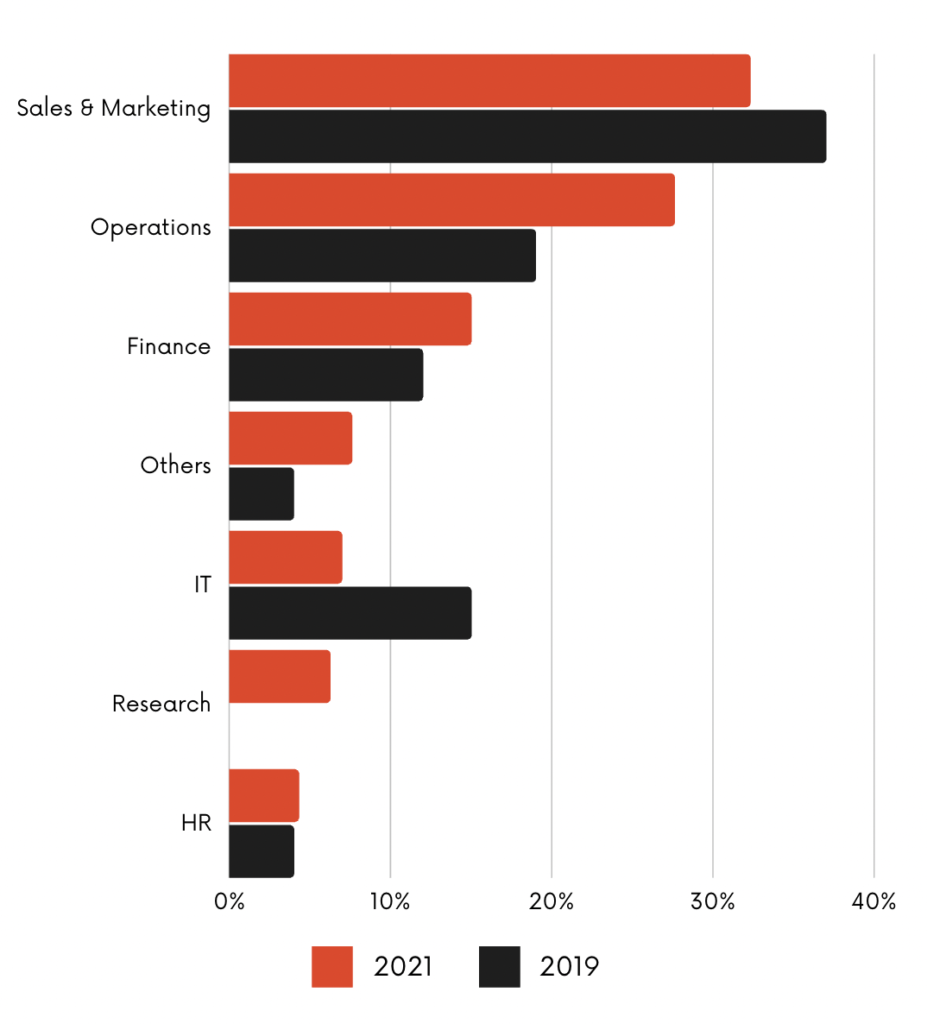
Despite the high adoption rate, our study finds that analytics is leveraged as a support function for traditional operations like Sales & Marketing, Operations, and Finance instead of a fully standalone service part of IT.
- 32.3% of analytics functions in large Indian organisations support the Sales & Marketing group, around the same as in 2019 (37%).
- 27.6% support the Operations function, a significant increase from 19% in 2019.
- Around 15.0% support the Finance department.
- Analytics functions do not usually fall under the IT unit of Indian firms. Only 7.0% of the total analytics functions are a part of the IT of these big enterprises.
- More companies are investing in R&D, with 6.2% of the analytic functions now a part of the Research teams in large enterprises in India.
Analytics Budget
Average Annual Analytics Budget
The largest 50 firms in India had an analytics budget of around $2 billion in 2021, with an average of $26.9 million per company. This average varied significantly across industries.
- Private Sector Banks had the highest average annual budget for data science at $88.5 million per company. This is almost six times greater than the analytics budget of Public Sector Banks that averaged at $16.1 million per company.
- E-commerce firms had the second-highest budgets, with an average budget of $49.7 million for their analytics functions.
- The average annual analytics budget of Oil Drilling & Refinery enterprises in 2021 was $34.2 million.
- This was followed by Financial Services, Telecom, and Public Sector Banks at $18.4 million, $17.7 million and $16.1 million, respectively.
- Steel and Power companies had the lowest analytics budgets with an average of $8.3 million and $3.6 million, respectively.
Penetration vs Maturity (PeMa Matrix)
PeMa Quadrant 2021

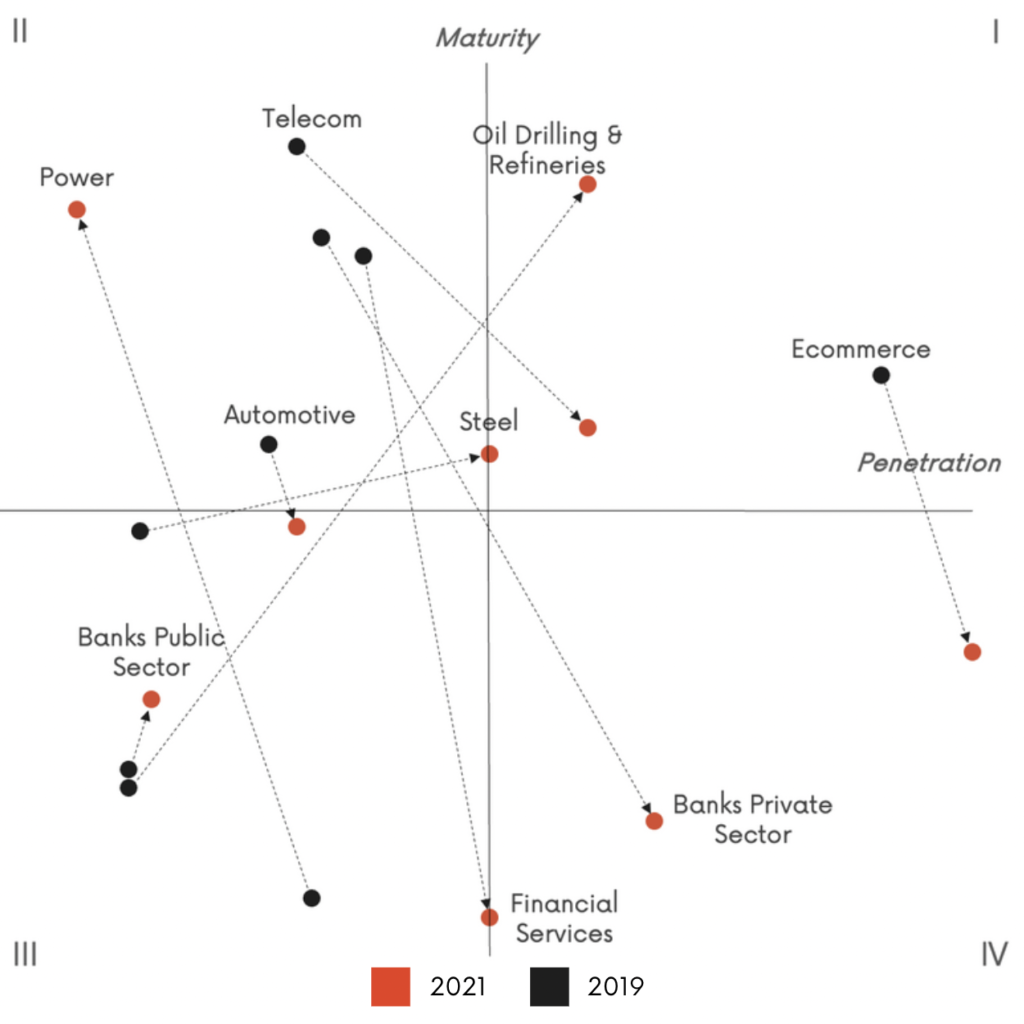
The PeMa Quadrant measures industries on two parameters: Analytics Penetration and Analytics Maturity. As outlined earlier, maturity signifies the scope of analytics within an organisation, while penetration measures the approximate number of analytics professionals employed by the organisation for every employee within the whole firm.
A greater analytics penetration can indicate a higher focus on data-driven decision making within the industry. While the penetration measures the quantitative progress, it is essential we also consider the maturity to analyse the kind of analytics being implemented and the work experience of professionals working on it.
- Quadrant I indicates organisations that are raising the bar in terms of penetration and maturity. The success of enterprises in this Quadrant comes from a high level of depth in analytics penetration as well as maturity.
- Oil Drilling & Refineries and the Telecom sector make it to Quadrant I in 2021.
- Oil companies are doing well in terms of maturity as they hire analytics professionals in strategic positions.
- Many of them are working on advanced analytics to develop sophisticated AI applications.
- The Telecom industry performs well in terms of its median tenure and employee experience.
- The Steel industry makes it in between Quadrant I and Quadrant II, indicating a high maturity and a relatively high penetration.
- Quadrant II consists of firms scoring big on analytics maturity. However, they do not perform well when it comes to penetration.
- Quadrant II consists of the Power sector.
- Traditional sectors are reshaping their strategies with high maturity in their analytics functions — there is still scope for improvement in terms of analytics penetration.
- Quadrant III represents enterprises lagging considerably behind in both penetration and maturity.
- Firms in Quadrant III are mainly Public Sector Banks or Automotive companies.
- Public Sector Banks do better than Private Sector Banks when it comes to analytics maturity. However, this score is still considerably low when compared to all the remaining sectors.
- The automotive industry falls just short of making it to Quadrant II, scoring relatively well in analytics maturity. However, the sector has one of the lowest penetration.
- Non-banking Financial Service enterprises have the same penetration as Steel, and they have the lowest maturity among all sectors. Both Quadrant III and IV share the sector.
- Quadrant IV has companies with great potential. They fare well in terms of analytics penetration but have a scope for improvement in terms of their analytics capabilities.
- E-commerce has significantly higher penetration as compared to other companies. With Data Science becoming a core part of the e-commerce sector, all mid to large e-commerce firms have some form of analytics adoption.
- Private Sector Banks also do relatively better than most sectors when it comes to analytics penetration. However, they lag when it comes to maturity.
Comparison With PeMa 2019
Several sectors have changed their quadrants over two years from 2019 to 2020.
- The E-commerce sector saw a significant drop in its maturity and hence, moved from Quadrant I in 2019 to Quadrant IV in 2021.
- Please note that maturity and penetration for each year is a relative index to other sectors. So, while the absolute maturity for e-commerce might have changed, it has decreased compared to other sectors this year.
- One of the most significant transformations was in the Oil Drilling & Refineries and the Power sectors. These traditional industries witnessed a jump in their maturity to move from Quadrant III in 2019 to Quadrant I and Quadrant II, respectively, in 2021.
- Private Sector Banks and non-banking Financial Services both improved on their analytics penetration. However, they have significantly dropped their maturity scores due to low median tenure and work experience. As a result, Private Sector banks moved from Quadrant II to Quadrant IV and Financial Services to the border of Quadrant III & IV.
- Public Sector Banks remained relatively unchanged to stay in Quadrant III. The Automotives sector slightly dropped in terms of its maturity to join Public Sector Banks in Quadrant III.
- Telecom and Steel both improved on their penetration to move to Quadrant I and on the border of Quadrant I & II, respectively.
Analytics Penetration Across Industries
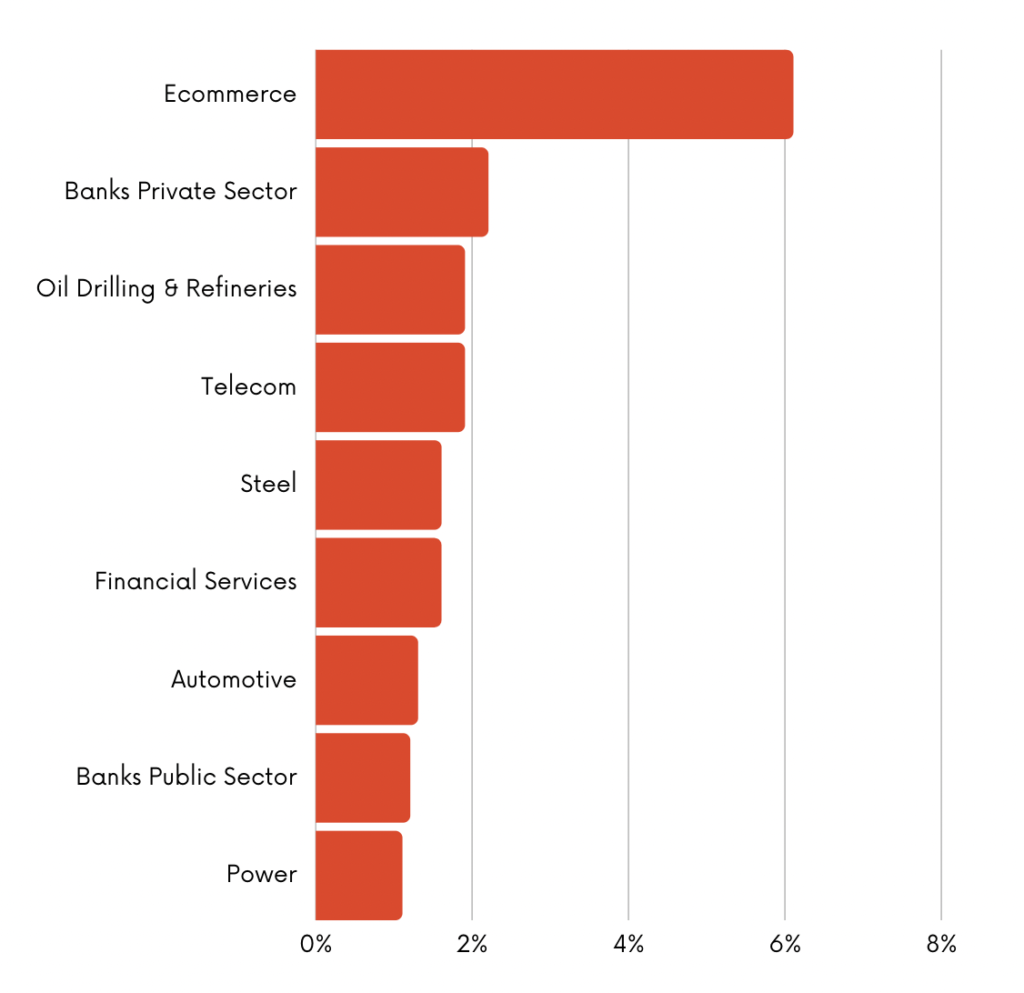
On average, large Indian firms have an analytics penetration of 2.0%. This essentially implies that for every 50 employees in the organisation, one employee is in some shape associated with data and analytics.
This is slightly lower than 2.5% in 2019. Overall, the large firms have decreased the proportional analytics headcount servicing their business this year. The penetration considerably varied across sectors.
- E-commerce was the outlier and had an analytics penetration of 6.1%, followed by Private Sector Banks at 2.2%
- Oil Drilling & Refineries and the Telecom sector have an analytics penetration of 1.9%, followed by Steel and Financial Services at 1.6%.
- The Automotive industry, Private Sector Banks, and Power sector had the lowest penetration at 1.3%, 1.2%, and 1.1%.
Average Tenure Of Analytics Functions

The average tenure of analytics professionals at Indian firms is 4.4 years, slightly higher than 4.0 years in 2019.
- Analytics employees of traditional industries like Power, Oil Drilling & Refineries, and Steel have a higher median tenure. Power has the highest average tenure at 6.6 years, followed by Oil Drilling & Refineries (6.1 years) and Steel (5.4 years). The average tenure for all these three industries has gone up compared to 2019, indicating an improvement in talent maturity.
- Despite the low adoption, Public Sector Banks (4.1 years) and the Telecom industry (3.9 Years) have a relatively higher median tenure. However, both of them have seen a drop in their medians since 2019.
- On the other hand, sectors with high analytics adoption, including Private Sectors Banks (3.5 years), Financial Services (2.8 years), and E-commerce (2.5 years), have lower average tenure. This can be mainly attributed to the younger task force working in tactical roles that tend to have a higher attrition rate.
Median Years Of Experience Across Industries

Seniority in years of experience indicates hiring analytics professionals in more strategic roles. This is representative of a higher maturity within the industry.
Overall, large Indian firms have a median work experience of 8.3 years. The study observed that traditional sectors tend to have analytics professionals with a higher median work experience.
- The Power Industry and the Telecom industry have the highest median at 10.2 years, followed by Oil Drilling & Refineries and Steel at 9.3 years and 8.9 years.
- Public Sector Banks (8.7 years) have a higher median than Private Sector Banks (7.9 years).
- The median for the Automotive industry stands at 8.4 years.
- E-commerce and the Financial Services sector had the lowest median employee experience at 7.8 years and 7.2 years.
Percentage Of AI In Analytics Functions
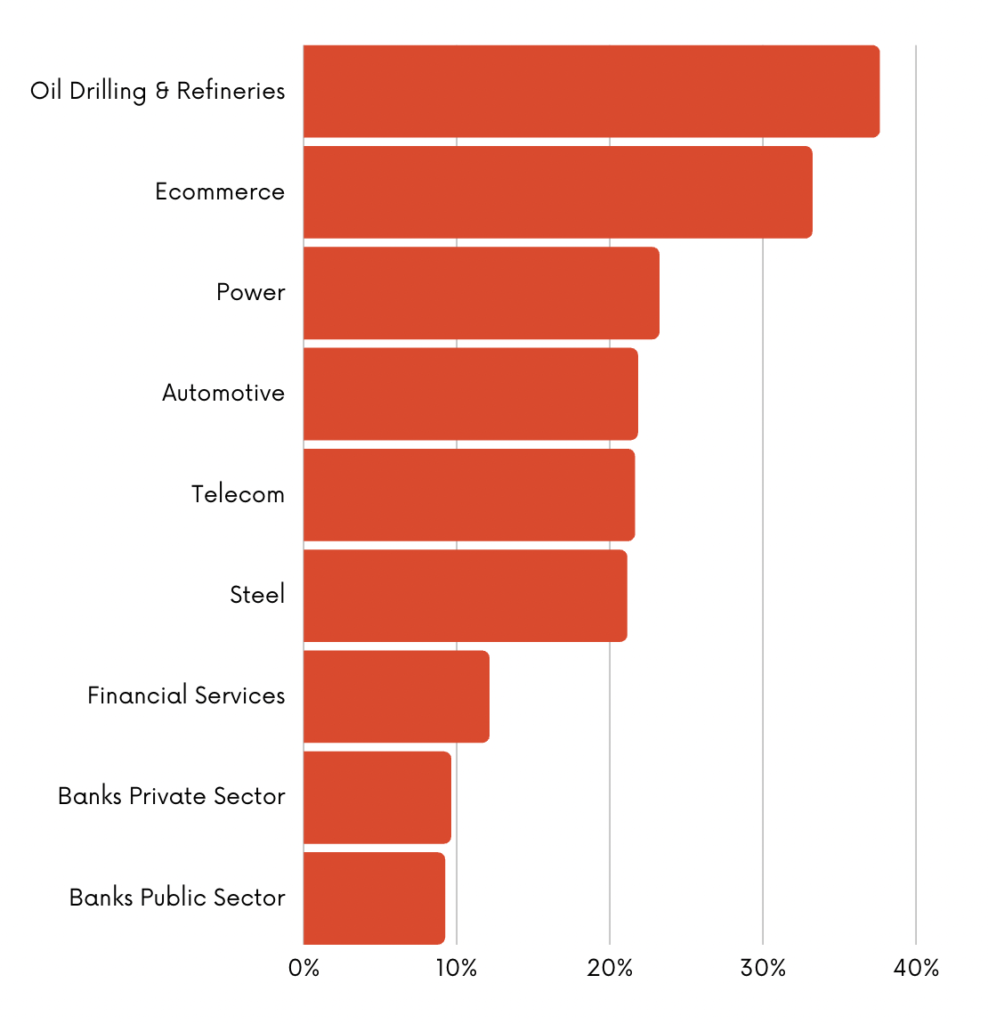
Around one in five or 19.1% of analytics professionals in large Indian companies work on Artificial Intelligence or advanced analytics.
- The Oil drilling & Refineries sector has the highest share (37.6%) of its analytics professionals working on AI, followed by E-commerce at 33.2% and Power at 23.2%.
- Automotive (21.8%), Telecom (21.6%), and Steel (21.1%) all have more than one in five of their analytics professionals working on AI.
- The Financial Services sector has the third-lowest percentage, with less than one in eight (12.1%) analytics professionals working in AI.
- Private Sector Banks and Public Sector Banks stand at 9.6% and 9.2%, respectively.
Download the complete report
The post State Of Data Science In Domestic Indian Firms – 2021 appeared first on Analytics India Magazine.
