Archives for exploratory data analysis
Exploratory data analysis allows manipulation of data sources to assist data scientists in checking hypotheses and discovering patterns.
The post 8 Online Courses For Exploratory Data Analysis appeared first on Analytics India Magazine.


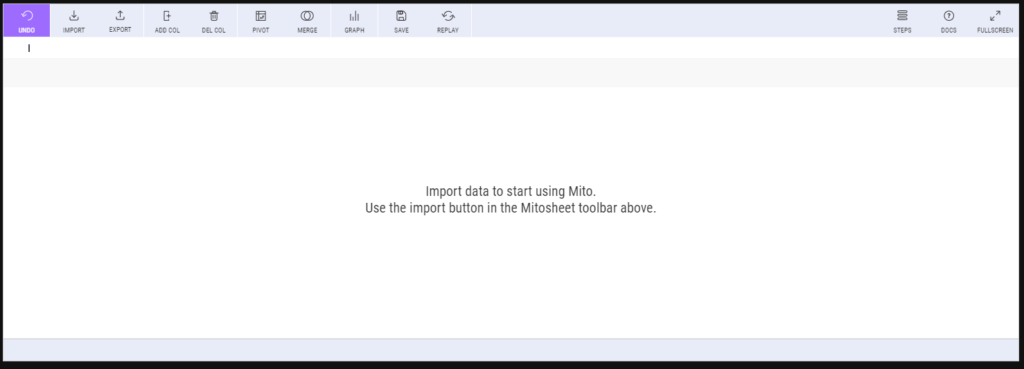
Mito is an open-source python library. For creating interactive dashboards and graphs with the. Mito makes EDA faster.
The post Guide To Mito – A Low Code Tool for Exploratory Data Analysis(EDA) appeared first on Analytics India Magazine.
The Association of Data Scientists has announced a hands-on workshop on exploratory data analysis and visualisation techniques.
The post Register For This Full Day Workshop To Master Exploratory Data Analysis appeared first on Analytics India Magazine.


Time series data is a set of observations collected through repeated measurements over time. Plotting the points on a graph, one of our axes would always be time. Time series data is everywhere since time is a constituent of everything observable. As the world advances every day with technology, sensors and systems constantly produce a…
The post Comprehensive Guide To Time Series Analysis Using ARIMA appeared first on Analytics India Magazine.


Analysis, in general, is the process of exploring a topic in particular by breaking and simplifying it into smaller sub-topics to gain insights and a better understanding. The process of evaluating a business and its associated resources such as projects, budgets, and other finance-related information is known as Financial analysis. Financial Analysis performed on a…
The post Exploring SimFin API Using Exploratory Data Analysis appeared first on Analytics India Magazine.
Why Effective Data Exploration And Visualisation Should Be Part Of Every Data Scientist’s Arsenal
“Always plot your data.” Martin Henze Data collection is tricky, data curation is tricky and everything about data is messy. EDA or exploratory data analysis via visual inspection makes data less terrifying. It exposes the outliers, it pulls the curtain on human biases. But performing EDA is a skill in itself and to demonstrate the…
The post Why Effective Data Exploration And Visualisation Should Be Part Of Every Data Scientist’s Arsenal appeared first on Analytics India Magazine.


Discovered in the 1970s by American mathematician John Tukey, exploratory data analysis (EDA) is a method of analysing and investigating the data sets to summarise their main characteristics. Scientists often use data visualisation methods to discover patterns, spot anomalies, check assumptions or test a hypothesis through summary statistics and graphical representations. EDA goes beyond the…
The post Exploratory Data Analysis: Functions, Types & Tools appeared first on Analytics India Magazine.
Pandas Visual Analysis is an open-source python library which is used to visually analyze the data and that too in just a single line of code. It creates a user interface that can be used to create different plots and graphs taking different attributes.
The post Hands-On Guide To Pandas Visual Analysis – Way To Speed-Up Data Visualization appeared first on Analytics India Magazine.
In this article, we will explore ExploriPy to perform EDA on a dataset and derive useful insights.
The post Hands-On Tutorial On ExploriPy: Effortless Target Based EDA Tool appeared first on Analytics India Magazine.


This article explores EDA Automation using Pandas Profiling, Sweetviz and Autoviz in the task of Creating Detailed EDA Reports, Creating reports for comparing 2 Datasets, and Visualizing the dataset.
The post Tips for Automating EDA using Pandas Profiling, Sweetviz and Autoviz in Python appeared first on Analytics India Magazine.

