Author Archives: Yugesh Verma - Page 22


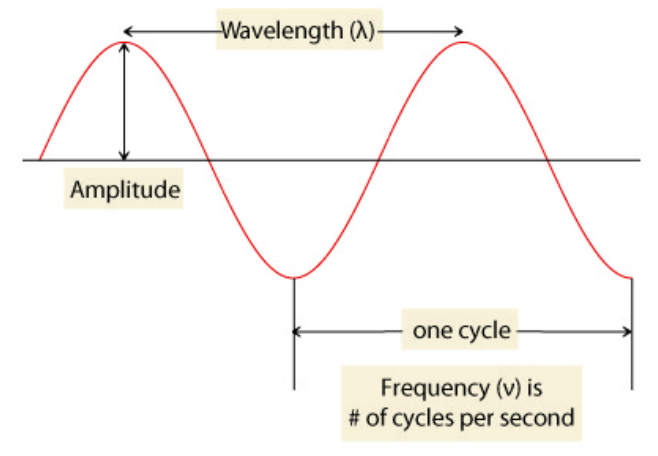
For visualising signals into an image, we use a spectrogram that plots the time in the x-axis and frequency in the y-axis and, for more detailed information, amplitude in the z-axis. Also, it can be on different colors where the density of colors can be considered the signal’s strength. Finally, it gives you an overview of the signal where it explains how the strength of the signal is
The post Hands-On Tutorial on Visualizing Spectrograms in Python appeared first on Analytics India Magazine.


SARIMAX(Seasonal Auto-Regressive Integrated Moving Average with eXogenous factors) is an updated version of the ARIMA model. we can say SARIMAX is a seasonal equivalent model like SARIMA and Auto ARIMA. it can also deal with external effects. This feature of the model differs from other models
The post Complete Guide To SARIMAX in Python for Time Series Modeling appeared first on Analytics India Magazine.


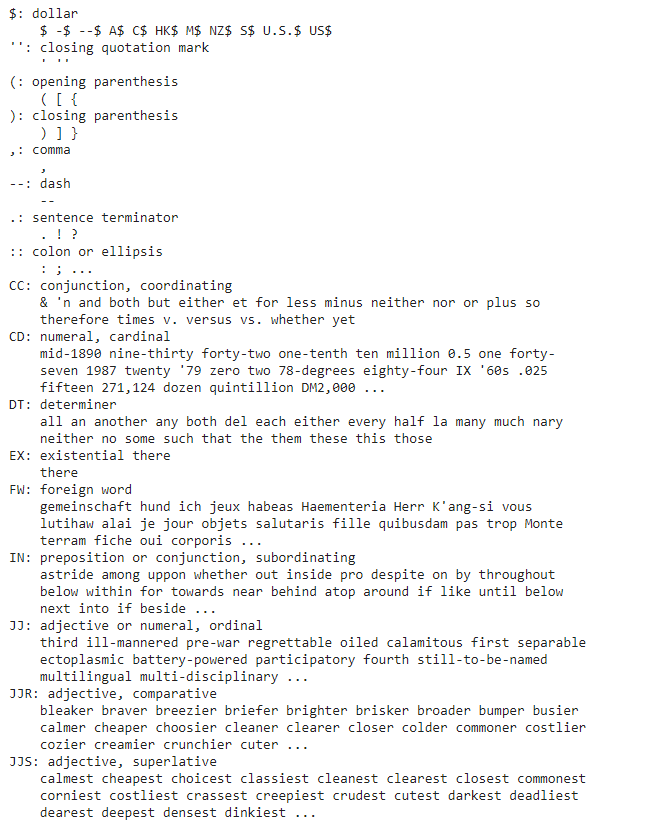
Classifying words in their part of speech and providing them labels according to their part of speech is called part of speech tagging or POS tagging OR POST. Hence the set of labels/tags is called a tagset. Next in the article, we will discuss how we can implement that POST part of any NLP task
The post Complete Tutorial on Parts Of Speech (PoS) Tagging appeared first on Analytics India Magazine.


BIRCH clustering algorithm is provided as an alternative to MinibatchKMeans. It converts data to a tree data structure with the centroids being read off the leaf. And these centroids can be the final cluster centroid or the input for other cluster algorithms like AgglomerativeClustering.
The post Guide To BIRCH Clustering Algorithm(With Python Codes) appeared first on Analytics India Magazine.


when we talk about the time-series data, many factors affect the time series, but the only thing that affects the lagged version of the variable is the time series data itself
The post Guide To AC and PAC Plots In Time Series appeared first on Analytics India Magazine.


The algorithm text rank came here to provide automated summarized information of huge, unorganized information. This is not the only task we can perform by the package. Instead of summarizing, we can extract keywords and rank the phrase, making a huge amount of information understandable in a very summarized and short way
The post Guide to NLP’s Textrank Algorithm appeared first on Analytics India Magazine.


Quantum computing is the field of computer science that mainly focuses on modern physics principles of quantum theory. Principles of quantum theories illustrate the behaviour of matters and energy at atomic and subatomic levels and Qiskit is an open-source quantum software development kit developed by IBM that provides help writing quantum computing programs
The post Beginner’s Guide To Qiskit for quantum Computing appeared first on Analytics India Magazine.


In template matching, we find out the location in the source image of the template image. Here we can understand that it is required to have the size of the source image larger than the template image.
The post Guide To Template Matching With OpenCV: To Find Objects In Images appeared first on Analytics India Magazine.


Pysentimiento comes to save us from all these hard-working processes. Pysentimiento is the best way to perform text classification and sentiment analysis. The best thing is that it has two features that we can use, we can analyze the text in two languages(English and Spanish) with a single module
The post Guide To Pysentimiento Toolkit | Text Classification Using Transformers appeared first on Analytics India Magazine.


In time-series data analysis, we seek the reason behind the changes occurring over time in time series, information points are gathered at adjacent time-spaces, there is a relation between observations, whether they can be proportional or unproportioned.
The post General Overview Of Time Series Data Analysis appeared first on Analytics India Magazine.

