Author Archives: Victor Dey - Page 27


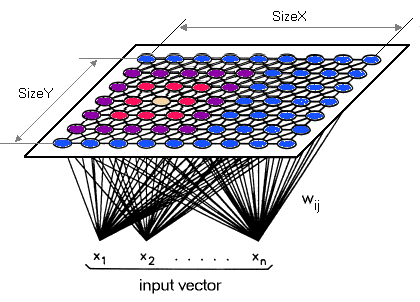
A self-organizing map is also known as SOM and it was proposed by Kohonen. It is an unsupervised neural network that is trained using unsupervised learning techniques to produce a low dimensional, discretized representation from the input space of the training samples, known as a map and is, therefore, a method to reduce data dimensions.
The post Beginners Guide to Self-Organizing Maps appeared first on Analytics India Magazine.


Bias and variance are inversely connected and It is nearly impossible practically to have an ML model with a low bias and a low variance. When we modify the ML algorithm to better fit a given data set, it will in turn lead to low bias but will increase the variance. This way, the model will fit with the data set while increasing the chances of inaccurate predictions. The same applies while creating a low variance model with a higher bias. Although it will reduce the risk of inaccurate predictions, the model will not properly match the data set. Hence it is a delicate balance between both biases and variance. But having a higher variance does not indicate a bad ML algorithm. Machine learning algorithms should be created accordingly so that they are able to handle some variance. Underfitting occurs when a model is unable to capture the underlying pattern of the data. Such models usually present with high bias and low variance.
The post How To Address Bias-Variance Tradeoff in Machine Learning appeared first on Analytics India Magazine.


AUC-ROC is the valued metric used for evaluating the performance in classification models. The AUC-ROC metric clearly helps determine and tell us about the capability of a model in distinguishing the classes. The judging criteria being - Higher the AUC, better the model. AUC-ROC curves are frequently used to depict in a graphical way the connection and trade-off between sensitivity and specificity for every possible cut-off for a test being performed or a combination of tests being performed. The area under the ROC curve gives an idea about the benefit of using the test for the underlying question. AUC - ROC curves are also a performance measurement for the classification problems at various threshold settings.
The post Understanding the AUC-ROC Curve in Machine Learning Classification appeared first on Analytics India Magazine.


Boltzmann Machine is a kind of recurrent neural network where the nodes make binary decisions and are present with certain biases. Several Boltzmann machines can be collaborated together to make even more sophisticated systems such as a deep belief network.
The post Beginners Guide to Boltzmann Machine appeared first on Analytics India Magazine.

